Passive reconnaissance
Extract from the Field Notes of Ponder Stibbons
The Patrician’s directive was unambiguous: assess the security of the Unseen University Power & Light Co. without causing a flicker in the city’s lights. This eliminated the standard pentester’s handbook. One could not simply rattle doors. One had to learn the art of listening.
This is an account of a practical reconnaissance against the UU P&L simulator. It is not a textbook recitation. It is a record of expectation, anomaly, and adaptation: the very essence of the work.
The hypothesis and the setup
The theory was sound. The simulator, a causally correct twin of the operational infrastructure, would generate its own network chatter: device telemetry, NTP synchronisation, MQTT publications, protocol gateway traffic. By attaching a listener to the correct network boundary, one could map the system by its own conversations.
The logical observation point was the DMZ zone (the Guild Quarter, in operational parlance): the segment between the public network and the enterprise interior. Everything transiting that boundary would be visible from a capture on the DMZ bridge interface.
$ ip link show | grep br-
5: br-ics_dmz: <BROADCAST,MULTICAST,UP,LOWER_UP> mtu 1500 state UP
With the simulator’s orchestrator running, capture began on the DMZ bridge:
$ sudo tcpdump -i br-ics_dmz -w uupnl_dmz_capture.pcap
tcpdump: listening on br-ics_dmz, link-type EN10MB, snapshot length 262144 bytes
^C6841 packets captured
Nearly seven thousand packets. The Guild Quarter, it appeared, was busier than its quiet facade suggested.
Silence in expected places
The first analytical filter was for the universal languages of industry, applied in Wireshark:
tcp.port == 502for Modbus.tcp.port == 2404for IEC-104.tcp.port == 20000for DNP3.
Result: Empty.
This was the first critical finding. The control zone was not broadcasting into the DMZ. Whatever Modbus traffic existed between PLCs and relays, it was entirely contained within the operational and control subnets. From this vantage point, the industrial control systems were acoustically dark. This is, in principle, the correct design. The interest lay in what was not dark.
Finding the true signal
Abandoning assumptions, the analysis turned to the data itself. The Statistics > Conversations > IPv4 view
provided the map.
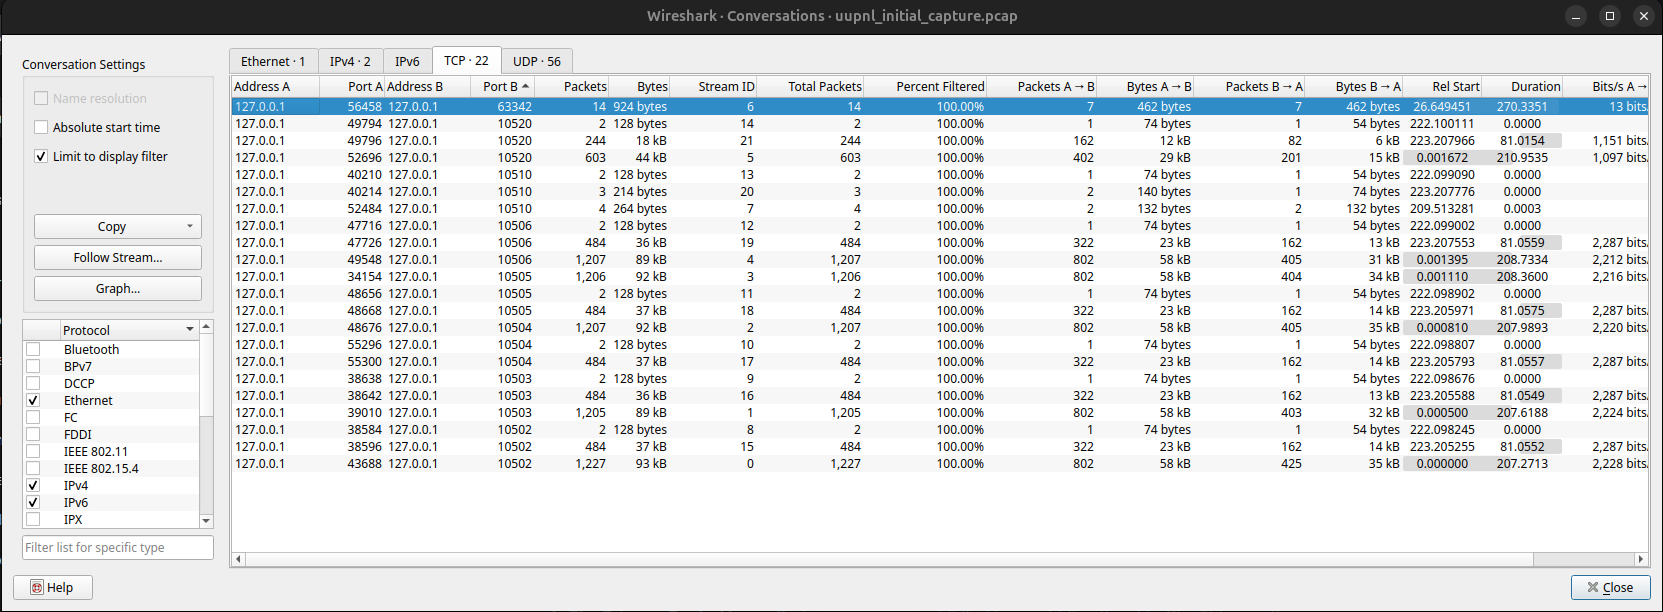
The raw output was a list of conversations, the most telling of which are summarised here:
Source |
Destination |
Packets |
Bytes |
Inference |
|---|---|---|---|---|
|
|
2,104 |
186,252 |
Sustained, high-volume telemetry. |
|
DMZ clients |
1,841 |
165,690 |
Very uniform, tiny packets. Timing service. |
|
|
612 |
53,856 |
Moderate, bidirectional. Gateway behaviour. |
|
|
8 |
528 |
Sporadic, minimal. Event-driven field device. |
random clients |
|
4 |
264 |
Occasional. Human-paced access point. |
The pattern was now clear. The Guild Quarter was running five distinct conversations, each with a different character.
The map and its meaning
10.10.5.11 → 10.10.5.12:1883: High-volume, steady-rate, small packets pushing outbound. Port 1883 is MQTT. The
source publishes; the destination receives and holds. This is a telemetry aggregator, something in the DMZ
collecting process data and routing it northbound via a message broker. An attacker who can subscribe to that
broker inherits whatever telemetry the source has collected, and may be able to inject writes back into any
southbound device the gateway is configured to reach.
Deduction: A data gateway forwarding process readings. The MQTT broker is the aggregation point. Worth examining what the gateway can reach in the operational zone.
10.10.5.30:123 → multiple: Uniform, tiny packets at sub-second intervals radiating outward from a single source
on UDP port 123. NTP. A clock service running without a client filter, answering any host that asks. The
uniformity of packet sizes and intervals is the tell: no authentication exchange, no per-client negotiation, pure
timing signal.
Deduction: A network time service with no access restriction. Time manipulation here affects log timestamps and certificate validity windows across every DMZ host that trusts it. An attacker who can shift these clocks corrupts the forensic record before the incident is reported.
10.10.5.10 ↔ 10.10.5.13:4840: Moderate traffic, bidirectional, request-response pattern. Port 4840 is OPC-UA.
Something in the DMZ is maintaining a persistent conversation with an OPC-UA server on the same segment, which in
turn has a path toward the operational zone. This is a gateway pair: a web-facing component and a protocol server
sitting between external data consumers and the operational network.
Deduction: A protocol bridge. The OPC-UA server is a key lateral movement opportunity; if it accepts anonymous connections, it may expose operational methods as well as data.
10.10.5.14:2404 → 10.10.2.20: Only eight packets in the entire capture. Port 2404 is IEC-104. The source is in
the DMZ; the destination is in the operational zone. Sporadic, consistent with a device that reports on change
rather than on a constant poll schedule.
Deduction: A substation or field device communicating with the SCADA. Low frequency does not indicate low importance. A device that only speaks when something changes is the one worth watching when something changes, and worth examining for whether its readings can be injected before they reach the SCADA.
random → 10.10.5.20:22: Four packets. SSH handshake fragments. Something occasionally connects to port 22 in the
DMZ. The intervals are human-scale, not automation.
Deduction: An access point used by people, not machines. Contractors or administrators reaching into the network from outside. Worth noting the software version banner when active probing begins.
The lesson of the missing detail
This exercise underscores a foundational rule. Passive reconnaissance does not name devices; it classifies behaviours. It tells you what something does (a telemetry aggregator, a timing service, a bridging gateway, a change-driven field device, an access point), not what label appears on its chassis. This behavioural map is often more useful than a labelled diagram, because it reveals function, criticality, and relationship.
The silences are information too. The entire control zone contributed eight packets to the DMZ capture. That says something about the segmentation that no network diagram will tell you as directly. It also defines the boundary: what passive listening can classify, and where the next phase of work begins.