Passive reconnaissance
Extract from the Field Notes of Ponder Stibbons
The Patrician’s directive was unambiguous: assess the security of the Unseen University Power & Light Co. without causing a flicker in the city’s lights. This eliminated the standard pentester’s handbook. One could not simply rattle doors. One had to learn the art of listening.
This is an account of a practical reconnaissance against the UU P&L simulator. It is not a textbook recitation. It is a record of expectation, anomaly, and adaptation—the very essence of the work.
The hypothesis and the setup
The theory was sound. The simulator, a causally correct twin of the operational infrastructure, would generate its own network chatter: SCADA polls, historian queries, device telemetry. By attaching a listener to the correct network conduit, one could map the system by its own conversations.
The logical observation point was the loopback interface (lo), the internal roundabout where 127.0.0.1 hosts all
local services.
$ ip addr show | grep -A 3 "lo:"
1: lo: <LOOPBACK,UP,LOWER_UP> mtu 65536 qdisc noqueue state UNKNOWN group default qlen 1000
    link/loopback 00:00:00:00:00:00 brd 00:00:00:00:00:00
    inet 127.0.0.1/8 scope host lo
       valid_lft forever preferred_lft forever
With the simulator’s orchestrator running in one terminal, capture began in another:
$ sudo tcpdump -i lo -w uupnl_initial_capture.pcap
tcpdump: listening on lo, link-type EN10MB (Ethernet), snapshot length 262144 bytes
^C9494 packets captured
Nearly 9,500 packets. The cacophony, it seemed, was present.
Silence in expected places
The first analytical filter was for the universal languages of industry, applied in Wireshark:
tcp.port == 502for Modbus.tcp.port == 102for Siemens S7.tcp.port == 20000for DNP3.
Result: Empty.
This was the first critical finding. The system was not using the well-known default ports. This is a common, if feeble, operational practice. Security through the obscurity of a changed number. The initial hypothesis was correct in spirit but wrong in detail.
Finding the true signal
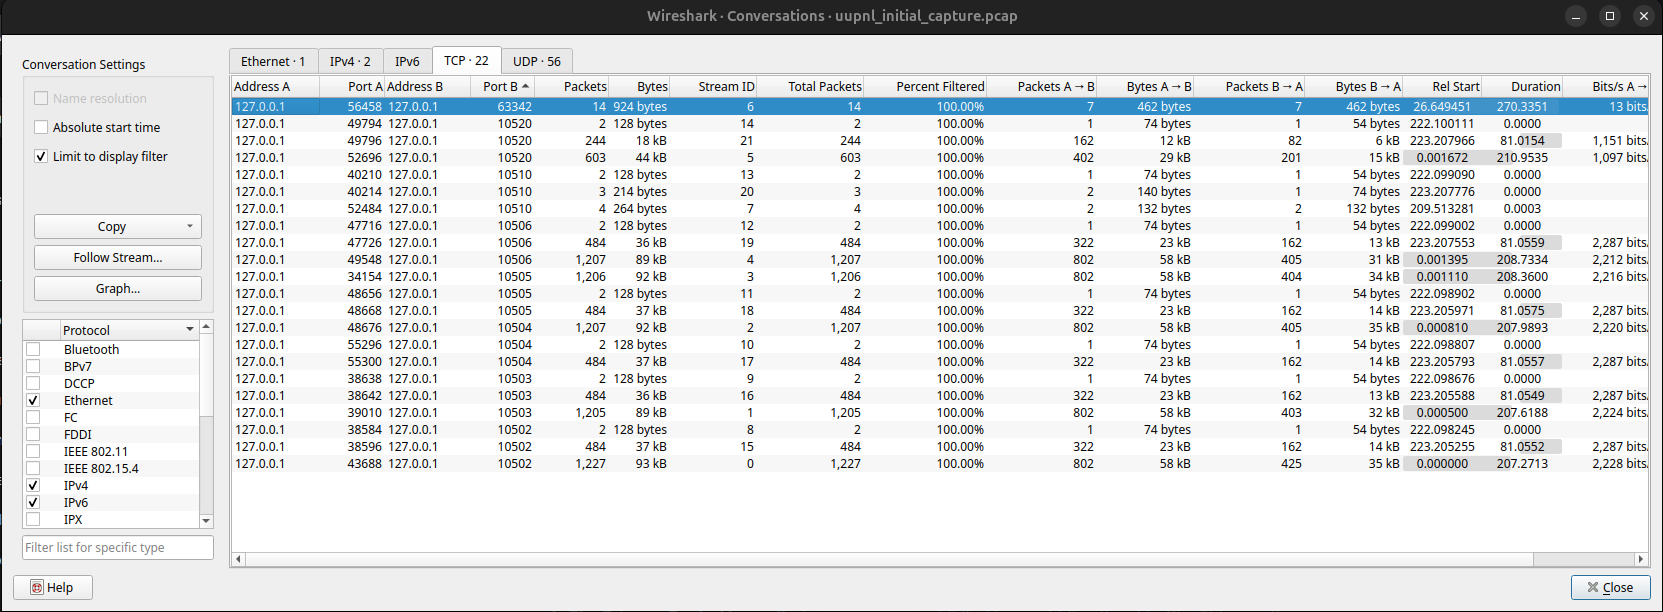
Abandoning assumptions, the analysis turned to the data itself. The command Statistics > Conversations > IPv4
provided the map.

The raw output was a list of conversations, the most telling of which are summarised here:
Client (127.0.0.1) |
Server (127.0.0.1) |
Packets |
Bytes |
Inference |
|---|---|---|---|---|
Port |
Port |
1206 |
92,196 |
Sustained, high-volume polling. |
Port |
Port |
1227 |
92,782 |
Sustained, high-volume polling. |
Port |
Port |
1205 |
89,330 |
Sustained, high-volume polling. |
Port |
Port |
1207 |
92,262 |
Sustained, high-volume polling. |
Port |
Port |
1207 |
89,062 |
Sustained, high-volume polling. |
Port |
Port |
603 |
44,198 |
Moderate, aggregated polling. |
Port |
Port |
484 |
36,680 |
A second, later control session. |
Port |
Port |
4 |
264 |
Sporadic, minimal communication. |
The pattern was now clear. The industrial conversation was not on ports 502 or 102, but on a reserved block:
10502 through 10520.
The map and its meaning
Ports 10502, 10503, 10504, 10505, 10506: High-frequency, bidirectional, request-response traffic. The packet
analysis shows a consistent pattern: a request (e.g., Modbus Function Code 3: Read Holding Registers) followed
immediately by a response of data.
Deduction: These are polled field devices, PLCs or RTUs, under constant supervisory control. The high volume indicates
they are critical, real-time process controllers (turbines, reactors, environmental systems). The presence of a
safety-signatured port (10503) operating with identical patterns to a primary controller (10502) suggests a
redundant or monitoring system for a high-value asset.
Port 10510: Minimal, sporadic packets (only 4 total in the capture).
Deduction: This is a low-bandwidth or event-driven device. It could be a legacy system, a gateway that only speaks when necessary, or a substation RTU that reports breaker status on change rather than constant polling. Its quiet nature does not mean it’s unimportant. It could be a safety or protection device.
Port 10520: Moderate, sustained traffic (~600 packets), but less than half the volume of the core PLCs. Analysis
shows it both sends requests and receives data from multiple other ports.
Deduction: This is the supervisory master station. The SCADA server or data aggregator. It is the “brain” querying
the field devices (10502-10506) and possibly logging that data.
Port 63342: Very low, intermittent chatter from a high client port.
Deduction: This is non-control traffic. Likely a diagnostic, management, or historian connection (e.g., an OPC UA client for data archiving). It is not part of the real-time control loop.
The lesson of the missing file
This exercise underscores a foundational rule. Passive reconnaissance does not name devices; it classifies behaviours. It tells you what something does (a polled controller, a quiet monitor, a master station), not who it is labelled as. This behavioural map is, in many ways, more valuable than a labelled diagram. It reveals function, criticality, and relationship needed to plan the next, careful phase of engagement without ever needing to see a configuration file.