Mapping what the target leans on
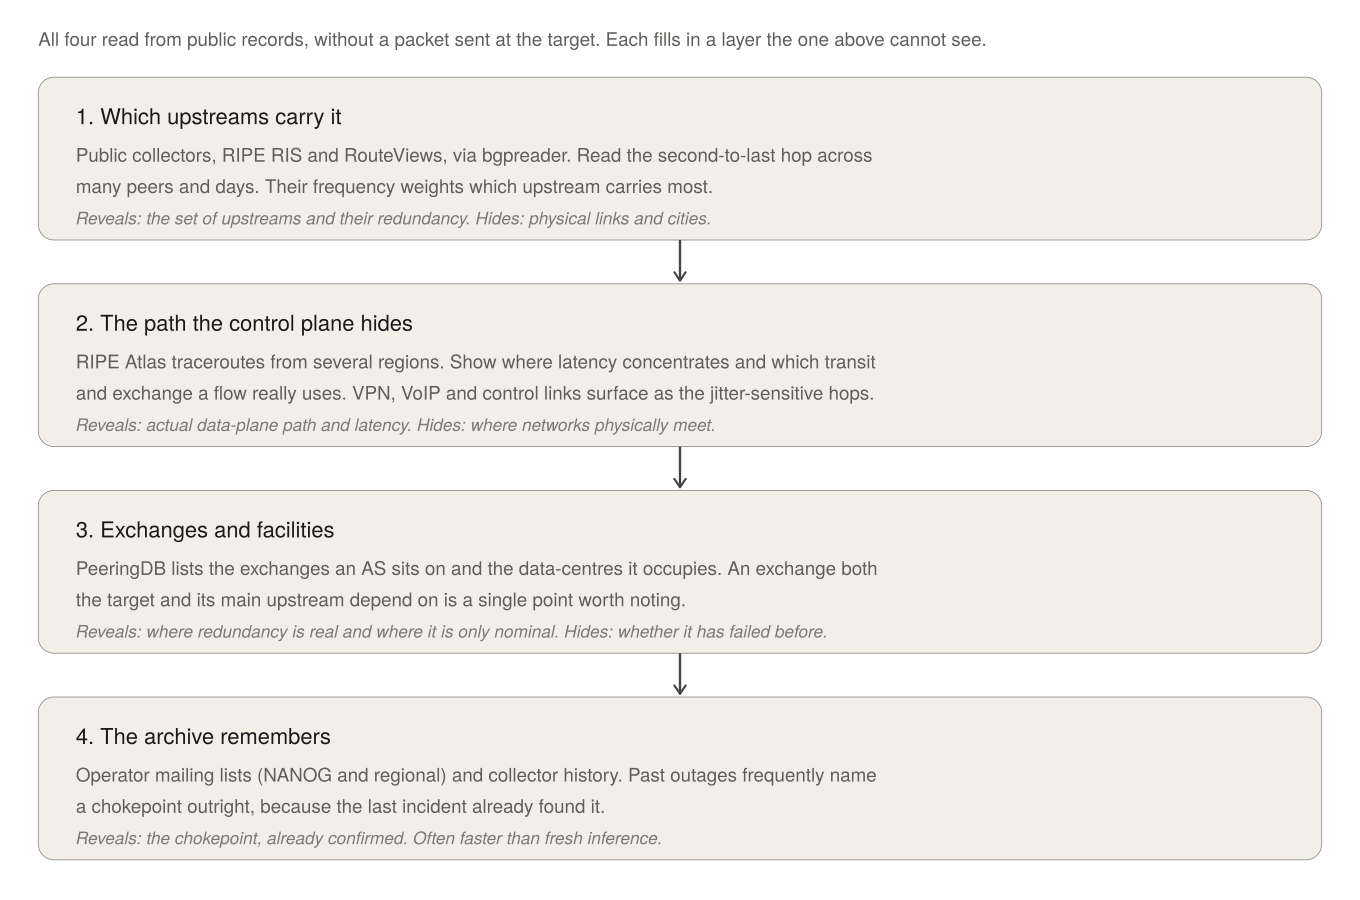
A target’s reachability rests on a handful of upstreams and exchanges. Finding which ones carry the weight is the difference between a change that lands and one that flaps harmlessly. All of it reads from public records, without a packet sent at the target.
Which upstreams actually carry it
The control-plane view comes from the public collectors, RIPE RIS and RouteViews, which write down every
route they hear. A RIB snapshot is the whole table at a moment; the historical question is “which upstreams
has this prefix used, and how stable has that been”. bgpreader (from BGPStream) pulls it:
bgpreader -p routeviews -c route-views2 \
  -w 1781337600,1781341200 \
  -k 203.0.113.0/24 -t ribs
The fields of interest in each record are the prefix, the AS_PATH, and the origin:
... |203.0.113.0/24| ... |6939 3356 64500|64500| ...
... |203.0.113.0/24| ... |2914 174 64500|64500| ...
Read across many peers and a few days, the second-to-last hops (3356, 174 above) are the prefix’s
upstreams, and their relative frequency is a rough weighting of which carries most. A prefix that always
appears behind one upstream is single-homed and fragile; one behind several has redundancy, and the redundancy
is itself the map.
The data-plane path the control plane hides
The AS_PATH says which networks a route crossed, not which physical links or cities. Traceroute fills that in. RIPE Atlas runs thousands of probes worldwide and exposes their measurements:
https://atlas.ripe.net/api/v2/measurements/?target=203.0.113.5&type=traceroute
Traceroutes from several regions toward the target show where latency concentrates and which transit and exchange a flow really uses. Latency-sensitive services, VPNs, VoIP, control links, are visible here as the hops where jitter would bite first.
RIPE Labs’ Introducing Region Meshes: Visualising Intra-Region Routing Paths turns this into a picture, showing how traffic moves inside a region and where it unexpectedly leaves, which surfaces hidden transit relationships and chokepoints faster than reading paths as text.
Exchanges and facilities
PeeringDB records where networks meet. An AS page lists the internet exchanges it sits on and the data-centres it occupies:
https://www.peeringdb.com/asn/64500
Two networks present at the same exchange can peer directly; an exchange that both the target and its main upstream depend on is a single point worth noting. Overlap in facilities hints at where redundancy is real and where it is nominal.
The archive remembers
The Internet keeps its scars. Past outages, written up on operator mailing lists (NANOG and the regional equivalents) and in collector history, frequently name a target’s chokepoint outright, because the last incident already found it. A search of the archives is often faster than fresh inference.